Category Archives: debugging

How do headsets know they may trigger Google Assistant or Siri?

I don’t know what the Bose QC35-ii is doing: the Action button refuses to do anything unless it’s sure it’s talking to either Google Assistant or Alexa (no Siri mentioned in the app, interestingly).

I can’t get the 2021 version of the Star Trek TNG Bluetooth Combadge to trigger anything when connected to a Linux machine. The regular press is triggering KEY_PLAYCD and KEY_PAUSECD, thus mapping onto the relevant X events and interacting well with my desktop’s media players (particularly Chrome) — but doublepress, which normally activates Siri on my iPad, sends no input device events on the relevant /dev/input/event* special file. There’s just no traffic.

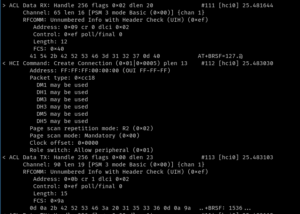
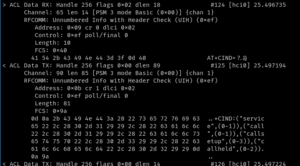
btmon is an interesting discovery, and it pointed me in the direction of the world of AT commands flowing as ACL Data on my local hci0 device. Many of the ones flowing are documented on Qt Extended’s modem emulator component documentation from 2009: it starts with the combadge sending AT+BRSF and seeing a response, then sending AT+CIDN and getting and response, and so on and on and on.

If I am reading everything right, the values returned are decimal numbers representing a binary mask. btmon output seems to indicate the combadge (‘hands-free’ device) claims it supports 127 (i.e. all 8 functionalities in the Modem Emulator docs), and the desktop (‘audio gateway’) says it supports 1536, which is binary 110 0000 0000, meaning the only bits that are set are in the reserved range from the perspective of the 2009 Modem Emulator documentation.

A list of flags can also be found in 2013 bluez test for HFP. Over there, one of the formerly ‘reserved’ bits is specified as being AG_CODEC_NEGOTIATION, but we can luckily find the other one in ChromiumOS’s source code: inside something called adhd (apparently, ChromiumOS Audio Daemon) and its cras component’s server part, the constants are in cras_hfp_slc.h. So, the other bit the desktop claims to support is AG_HF_INDICATORS, which also has nothing to do with remote control.

That source code also indicates we can read the Hands-Free Profile specification, the latest one being version 1.8 available on Bluetooth.com.

So, if I am interpreting everything correctly, the combadge says it supports “everything”, but the desktop doesn’t tell it back that it knows what voice recognition is. No wonder we’re not seeing any traffic.

So, we don’t quite need to support Apple-specific HFP commands such as AT+XAPL (bluetooth accessory identification), AT+APLSIRI (confirming the device supports specifically Siri) or AT+IPHONEACCEV (sharing battery level), which is nice. Both of the platforms documented by the combadge’s marketing materials and the manual (Google Now i.e. Assistant and Siri) document they support AT+BVRA from the Hands-Free Profile specification; see Google Assistant’s “Voice Activation Optimization” document for Bluetooth devices, as well as the “Accessory Design Guidelines for Apple Devices (release R16 talks about this in section 30.3.1).

Instead, it looks like we mainly need to trick the desktop to respond to combadge’s AT+BRSF request with a bitmask that includes the voice recognition bit, and move on from that, hoping the combadge starts emitting AT+BVRA, and that we can easily programmatically capture that!

But that’s a topic for another post.

Patching an unrecognized selector into a misbehaving OS X app

Let’s say you have an app that misbehaves. As in, it raises an exception mentioning an unrecognized selector.

Of course, it’s third party and closed-source.

But you are an enterprising young developer and you really want to patch this app.

I will not identify the app that I patched, to avoid any impression that I’m cracking the app. (It’s a popular app and I’ve run into pretty nice anti piracy protection blocking gdb on multiple layers. Since I’m not familiar with cracking and was not even attempting that, I’ve decided that it’s best to simply avoid mentioning the app name.)

Makefile

all: misbehavingappfixer.dylib

misbehavingappfixer.dylib: misbehavingappfixer.o
        gcc \
                -dynamiclib \
                -undefined suppress -flat_namespace \
                misbehavingappfixer.o \
                -framework Cocoa -o misbehavingappfixer.dylib
run:
        DYLD_FORCE_FLAT_NAMESPACE=1 DYLD_INSERT_LIBRARIES=`pwd`/misbehavingappfixer.dylib /Applications/Misbehaving\ App.app/Contents/MacOS/Misbehaving\ App

misbehavingappfixer.c

#include 
#include 
static CFStringRef nameImp(id self, SEL _cmd)
{
        return CFSTR("IVFlawedClass");
}

void inject_init(void) __attribute__((constructor));
void inject_init(void)
{
        Class _IVFlawedClass = objc_getClass("IVFlawedClass");
        if(!_IVFlawedClass)
        {
                printf("Could not find IVFlawedClass");
                return;
        }

        SEL nameSel = sel_registerName("name");
        class_addMethod(_IVFlawedClass, nameSel, (IMP)nameImp, "@@:");
}

I avoided using Objective-C because I had some issues when I tried going that route. It should work, but I didn’t want to spend any more time on this than I already have.

Now, to use this:

make
make run

This will compile the fix dylib, and then launch the Misbehaving App while first preloading our fix dylib.

For more information, see these:

Note: from comments on Mike Ash’s post, it seems that since I’m not overwriting symbols, I don’t need to (and, more importantly, *should* not) be using flat namespace. That means, I should not be using DYLD_FORCE_FLAT_NAMESPACE and -flat_namespace.

But, it works for me, so what the hell. 🙂

Symbolicating Mac app's crash reports — manually

You will need your released app’s dSYM bundle. Since you are a good developer, whenever you release a version of your software, you use Xcode’s built in Archive functionality, so you don’t have a problem with that. (Right?)

So open Xcode’s Organizer. Right click on your archive, and pick “Show in Finder.” Then right click on the archive, and choose “Show Package Contents”.

Enter the “dSYMs” subfolder, and find the sole .dSYM bundle in there. Right click on it, and “Show Package Contents”. Open Contents, Resources, DWARF — and you’ll reach the file that actually contains the debug symbols. For example, “GeorgesGreatApp”, without any extension. Wheeee!

Now, open Terminal. Punch in atos -o and drag and drop the “GeorgesGreatApp” file (the one that contains the debug symbols) into the terminal. Then punch in -arch x86_64 (or whatever architecture the crash occurred on). Finally, paste the address that you want to know more about.

For example, given the following line in the crash log:

1   net.vucica.GeorgesGreatApp    	0x0000000100001e91 0x100000000 + 7825

you’d take the first hex number that appears on that line, and have this on the command line:

atos -o /Users/YOURUSERNAME/Library/Developer/Xcode/Archives/2012-02-29/GeorgesGreatApp\ 29.02.2012.\ 00.40.xcarchive/dSYMs/GeorgesGreatApp.app.dSYM/Contents/Resources/DWARF/GeorgesGreatApp -arch x86_64 0x0000000100001e91

and you’d get this output:

-[GGAppDelegate generateThumbnailsForJpeg:] (in GeorgesGreatApp) (GGAppDelegate.m:326)

Extremely handy when Xcode screws up symbolication or outright refuses to import the crash log. Maybe it’s Xcode’s fault. Maybe Spotlight did not correctly index dSYM’s location. Maybe Spotlight did not correctly index .app’s archived location. Whatever it is, I don’t really care — if symbolication is broken, it’s broken. But at least I can use the underlying mechanism in atos.

Exploring Apple's customization of titlebar in Xcode 4

As you may have noticed, Xcode’s NSWindow does not actually have a single representedURL; it has two, the project and the current in-project file.

So how did Apple achieve that?

First things first, you can start figuring that out by yourself by asking your window’s contentView for its superview. Although undocumented, enough apps seem to be playing around with this (including Xcode) that I presume Apple would be reluctant to change something important here.

Second, I’m not going to actually show you any code just yet. Perhaps in a future blog post; I did start writing something, but it’s unfinished.

Third, there is no third: let’s get to it.

Hacking tools

Playing with contentView‘s superviews can only get you so far (although, you may be able to hack something anyway). Injecting code in form of plugins into Xcode is possible, as proven by JugglerShu’s XVim.

But there’s a nicer way.

Say hello to F-Script. It’s a nice scripting language and let’s-call-it mini-IDE in itself, but there’s something far more powerful it can do.

On F-Script

It has a full fledged object browser that uses introspection to figure out what the hell exists in the view hierarchy. It also has a nice view picker so you can easily access the exact view that you’re playing with. Python may be neat for programming, but this one is just smashing for debugging GUI apps.

F-Script is not intended to be used as a standalone dev environment however; you’re supposed to put it into your app and use it at runtime. Kind of like what you can do with Python already… except this one comes with a runtime debugging GUI out of the box (and the aforementioned view picker!), and is pretty dedicated to playing with Cocoa and Objective-C (while Python can play with it through its PyObjC bridge – powerful, but not the best way to do it; also, method names become lengthy and weird when written in Python).

Note that I, for now, have absolutely no experience with F-Script as a programming language, and I don’t intend to learn it too much for now, just as I don’t intend to learn all nuts and bolts of GDB. It may be nice, but for now, it’s far, far, far more amazing as a debugging tool.

Okay, so where does playing with Xcode come in?

Unfortunately, not in the form of injecting the debugging code into Xcode and playing with it. This is the loveliest part of F-Script, however; you can inject it into any app and inspect how it works, see runtime class definitions, send messages to existing objects, etc. But not with Xcode, because of some magic that Xcode is doing causing F-Script to crash Xcode.

Side note: injection of F-Script is done via gdb. The F-Script Anywhere automator workflow intended to be put into ~/Library/Services actually consists of figuring out frontmost app’s process ID, constructing some gdb commands and running gdb. gdb commands used involve attach to existing process, then calling Objective-C method -[NSBundle load] on /Library/Frameworks/FScript.framework, and finally calling +[FScriptMenuItem insertInMainMenu] and detaching. Quite ingenious!

Finding the beast

Let’s get back to business. Although Xcode crashes, view inspector of F-Script works long enough to let us know the name of the class implementing the custom view Apple uses in the titlebar for displaying two “represented URLs”. A-ha! DVTDualProxyWindowTitleView, we’ve found you!

Now, where could this be defined? Let’s explore various private frameworks found in Xcode using class-dump (install it from MacPorts). And voila! Xcode.app/Contents/SharedFrameworks/DVTKit.framework. Using class-dump we can also see that it’s used in… DVTDualProxyWindow, a subclass of NSWindow. Wonderful!

Now, just trying to load this framework into standalone F-Script.app fails miserably and returns NO. At least for me. otool -L told me which frameworks this one depends on… so I loaded them first.

About the beast

Finally, DVTDualProxyWindow is a subclass of NSWindow which apparently overrides -setTitle: to do nothing, overrides -setRepresentedURL: to be used for the ‘project’ URL, and defines new method -setSecondaryRepresentedURL: to add the ‘document’ URL. Both of these methods are just talking to DVTDualProxyWindowTitleView. We don’t really care what happens behind the scenes; it’s just a regular view. But let’s see if it works.

Open F-Script app. Right click on the toolbar and choose ‘Customize’. Aside from customization sheet, a new window appears titled ‘Custom Buttons’. Pick one of ‘CustomX’ buttons, and select ‘Block…’. (Of course, prior to that, in the toolbar customization sheet, drag the picked button to the toolbar… you know, so you can click it.)

Now, paste in the following code.

Testing the beast

[:selectedObject | 


(NSBundle bundleWithPath:'/Applications/Xcode.app/Contents/SharedFrameworks/DVTFoundation.framework') load.

(NSBundle bundleWithPath:'/System/Library/PrivateFrameworks/DataDetectorsCore.framework') load.

(NSBundle bundleWithPath:'/System/Library/PrivateFrameworks/DataDetectors.framework') load.
(NSBundle bundleWithPath:'/System/Library/Frameworks/SecurityInterface.framework') load.
(NSBundle bundleWithPath:'/System/Library/Frameworks/Carbon.framework') load.
(NSBundle bundleWithPath:'/System/Library/Frameworks/CoreServices.framework') load.

errorPointer := FSObjectPointer objectPointer.
(NSBundle bundleWithPath:'/Applications/Xcode.app/Contents/SharedFrameworks/DVTKit.framework') loadAndReturnError:errorPointer.


" printing out an error: 
   errorPointer at:0.
"

"win := ((DVTDualProxyWindow alloc) init)."

win := DVTDualProxyWindow alloc initWithContentRect:(125<>513 extent:383<>175)
                                   styleMask:NSTitledWindowMask + NSClosableWindowMask + NSMiniaturizableWindowMask + NSResizableWindowMask
                                     backing:NSBackingStoreBuffered
                                       defer:NO.

(win setRepresentedURL:(NSURL fileURLWithPath:'/Applications/Xcode.app')).
(win setSecondaryRepresentedURL:(NSURL fileURLWithPath:'/Applications/Xcode.app')).


"Instantiate a button, put it in the window and configure it"
button := NSButton alloc initWithFrame:(247<>15 extent:90<>30).
win contentView addSubview:button.
button setBezelStyle:NSRoundedBezelStyle.
button setTitle:'Boo'.
button setKeyEquivalent:'\r'.

"An example of using F-Script blocks to handle click on button. Ignore it."
conversionScript := [(form cellAtIndex:2) setStringValue:(form cellAtIndex:0) floatValue * (form cellAtIndex:1) floatValue].

" From docs: "
"The [...] notation creates an object of class Block which represents a block of code that can be executed later (Block is an Objective-C class provided by the F-Script framework). In our block, we simply get the values of the fields in the user interface objects, perform the computation (simply involves multiplication) and put the result in a UI element.
"

"An example on how to add handling for button click. Ignore it."
"Make the script the target of the button.
The script will be evaluated when the user presses the button"
button setTarget:conversionScript.
button setAction:#value.


"Show window"
(win orderFront:nil).


]

Click on the ‘Run’ button, and type in ‘nil‘. (You don’t really care about the selectedObject, but I did not study F-Script long enough to avoid it.)

Hopefully this gives you enough idea to debug with, explore with, as well as an idea on how to implement dual-representedURL windows. Good luck and have fun! 🙂
Avoiding memory leak in OpenAL and crash in OpenAL for Mac

UPDATE: We’re still seeing the crash on Mac. Procedure described does fix the memory leak, though.

UPDATE 2: Crash on Mac is caused by what appears to be a bug in Apple’s code relating to queueing commands for execution on dedicated audio thread, and mutex lock breaking down. Since mutex lock seems to stop working, it’s only natural that a threading-related crash occurs.


When calling alSourceStop(), you might forget to unbind a buffer from the source. Did you unbind it?

alSourcei(this->sourceId, AL_BUFFER, AL_NONE);

If you get a crash on Mac with call stack containing OALSource::Play() and/or ending with OALSource::PrepBufferQueueForPlayback(), this is most probably a good fix. Looks like OpenAL on Mac might have a race condition somewhere unless you do this.

See difference between revision 293 and 294 in libxal, in file audiosystems/OpenAL/OpenAL_Player.cpp.

Finding memory corruption of a C++ class member variable using GDB

Source: Giant Water Bug by FreeLearning

Today I managed to catch a nasty bug of memory corruption of a C++ class member variable. This was related to a C cast being used in place of dynamic_cast. But more interesting is the way I caught the bug.

Luckily, the class that we saw get corrupted was the label, the corruption was very visible (a bool variable that should be permanently true was set to false) and the instance that we saw get corrupted was the game’s loading screen. Setting the breakpoint was easy, especially since I could easily just set it inside the constructor: loading screen contained the very first label instance that was created in the game.

Now, we were lucky that the memory that was corrupted was in our code. We were also very lucky to be able to pinpoint what gets corrupted before it gets corrupted.

Catching where it got corrupted could be a bit trickier if it weren’t for GDB.

So once the code stopped in the constructor, we issued this command manually to GDB:

watch -location mTextFormatted

This creates a hardware watchpoint that breaks execution when the location is read. You can alternatively use this syntax if you want to watch a specific memory location:

watch *((int*)0xdeadbeef

(substitute with correct C data type). Alternatively, there is rwatch and awatch. Read more on Stack Overflow

Xcode turned out to be very nice here. When the watchpoint is hit, it shows a sheet that alerts you pretty strongly that it was hit. Read more on Stack Overflow

Helpful post? Don’t forget to comment 🙂